Research Results
Detailed quantitative and spatial evaluation of our deforestation risk pipeline, validated against Hansen Global Forest Change data (2001-2023) for the Gia Lai pilot districts.
Model Performance (Internal Split)
Table 3| Model | AUC-ROC | Precision | Recall | F1 Score | Capture @ 10% |
|---|---|---|---|---|---|
| Baseline (Road Dist) | 0.563 | 0.579 | 0.974 | 0.726 | 12.2% |
| Logistic Regression | 0.788 | 0.663 | 0.851 | 0.745 | 17.6% |
| Random Forest (Best) | 0.892 | 0.806 | 0.856 | 0.830 | 17.5% |
Validation Context: Model performance evaluated on a 30% hold-out test set from the combined K’Bang and Mang Yang pilot data. Capture @ 10% indicates the percentage of total deforestation events correctly identified within the top 10% highest-risk predicted areas.
Model Validation (ROC)
Figure 3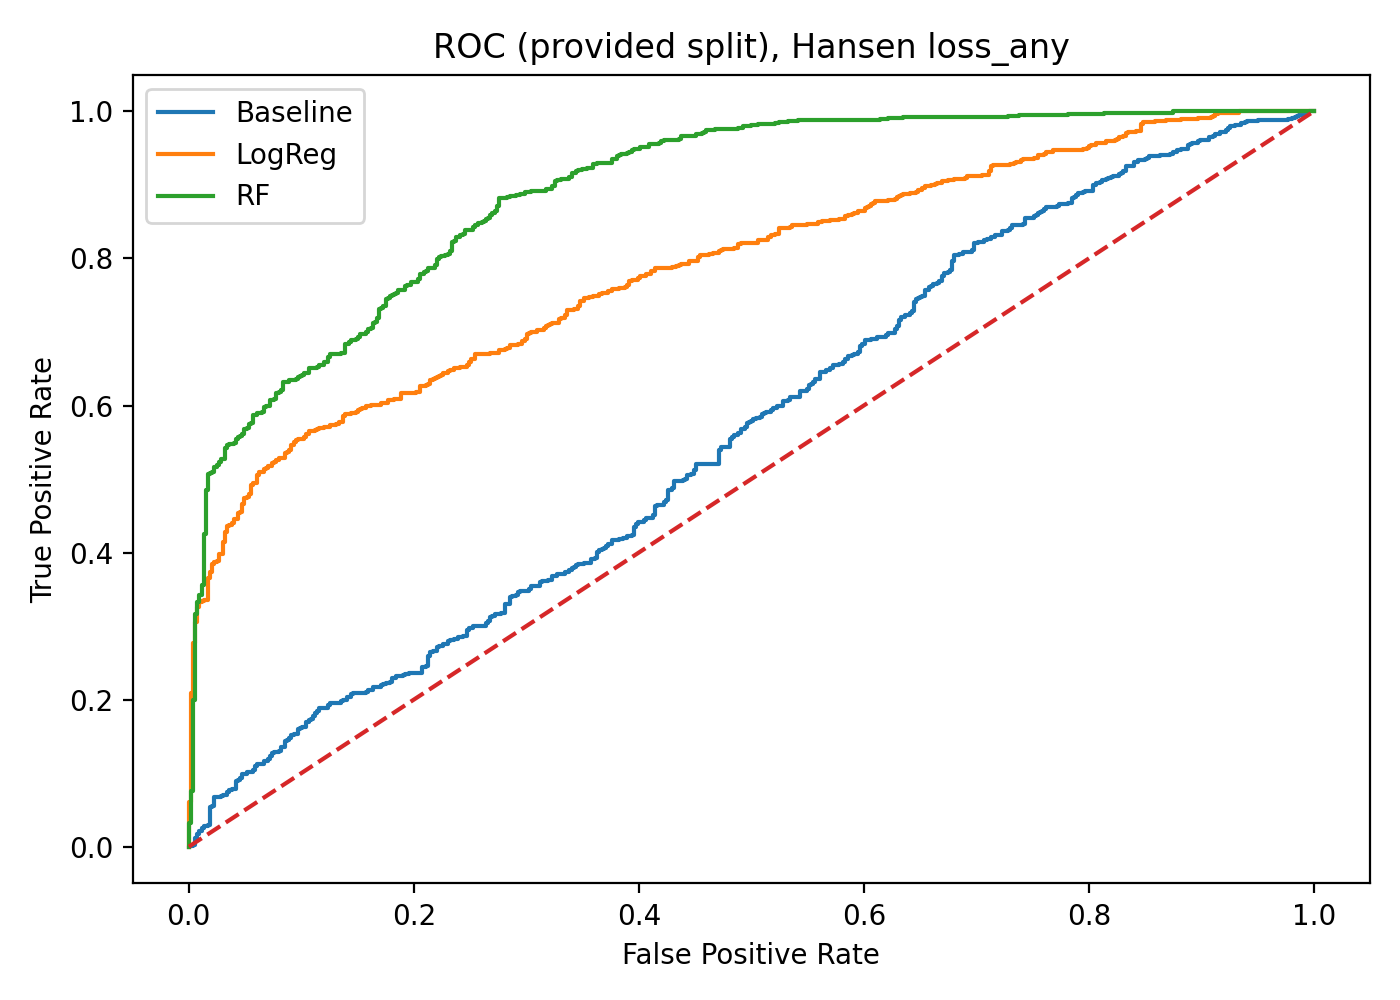
Receiver Operating Characteristic (ROC) curves for the evaluated models. The Random Forest model demonstrates superior predictive power with an AUC of 0.892, significantly outperforming the baseline heuristic.
Feature Importance (RF)
Figure 6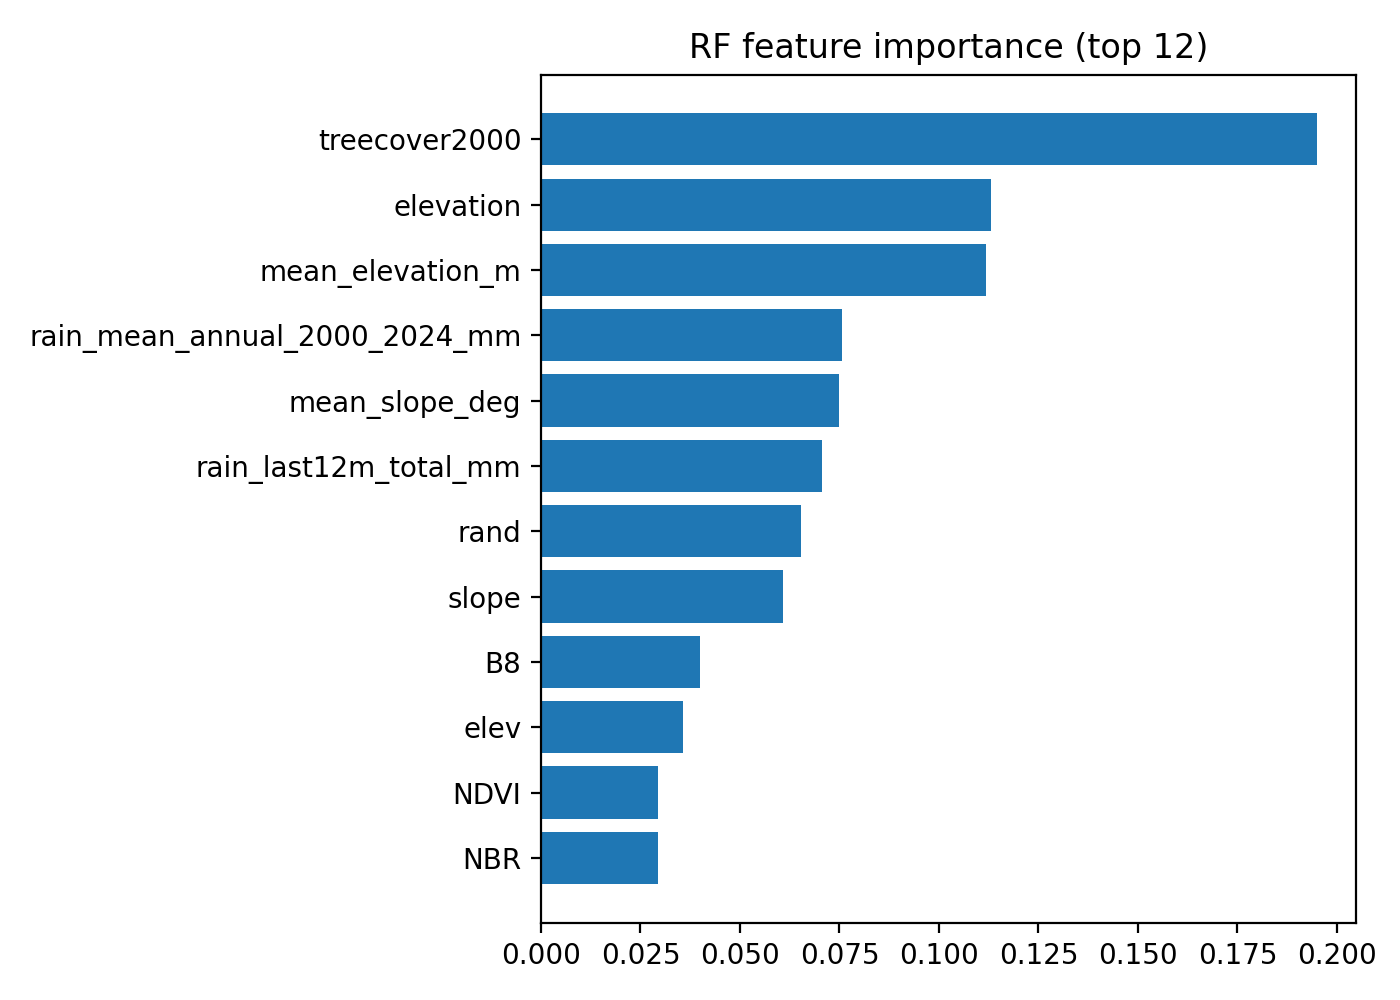
Relative importance of environmental and accessibility drivers. Road proximity, elevation, and vegetation condition indices (NDVI/NBR) emerge as the primary predictive signals in the Gia Lai pilot study.
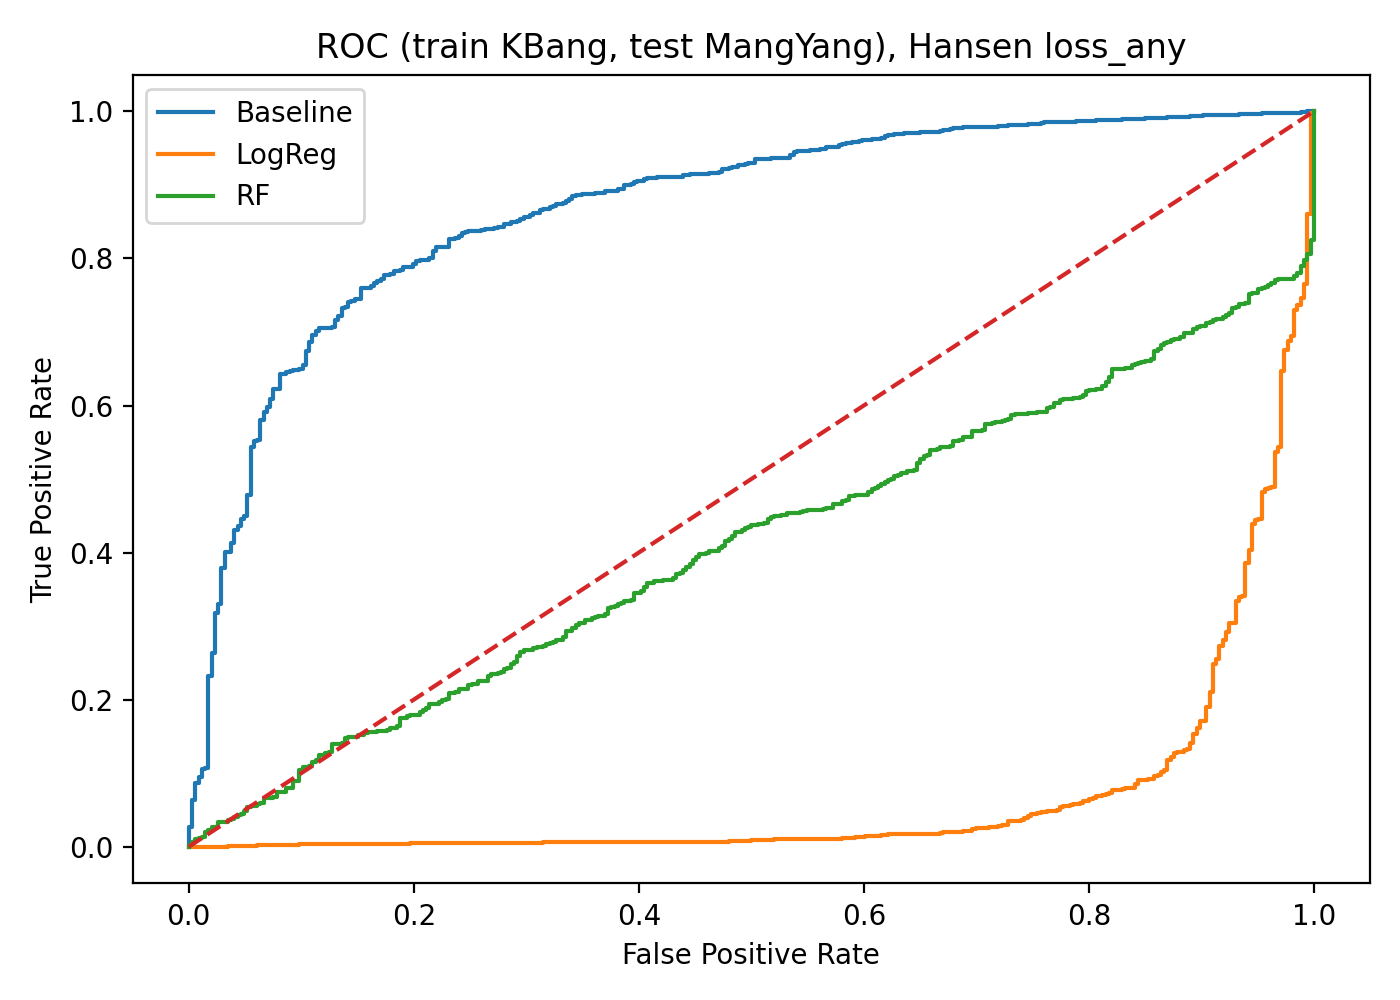
Spatial Transferability
To assess operational scalability, we tested the model's ability to predict risk in novel geographies by training exclusively in K’Bang District and testing on the Mang Yang District landscape.
The high baseline transferability (AUC 0.87) suggests robust, generalizable underlying drivers of deforestation across the province.
Export Research Data
Read the Full Manuscript
For a comprehensive discussion of these results, methodologies, and conservation implications, please review the complete academic manuscript.